Fleet Analytics
It is a problem familiar to many fleets and procurement category managers. Working with various leasing companies is further complicated by aggregating, processing and analysing data from incompatible systems.
We remove the complexity through our Cloud-based Fleet Analytics system. The platform allows clients to create bespoke dashboards, simplifying procedures such as transitioning suppliers or managing diversified supply chains.
Fleet Analytics does more than simplify the complex. It also supports the strategic direction of the fleet by helping identify opportunities both locally and globally. In addition, Fleet Analytics supports the deconstruction of the supply chain to achieve the maximum commercial advantage.
As well as measuring costs, savings and reductions in environmental impact, the system can also integrate supplier performance measures to give you a holistic picture of the service delivery.

Why Use Our Fleet Analytics Platform?
Flexible reporting that scales according to your needs and changes as your fleet does including mergers and acquisitions
Independent reporting reduces reliance on your suppliers for data
A cost-effective platform which drives actionable insight to help decision making
Track budgets and cost-saving initiatives
Keep your decarbonisation plan on track
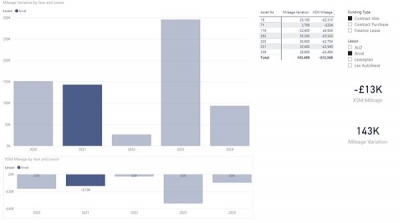
Example Screenshots


The Process

Connect
Firstly, we connect the data from internal systems and external systems in a variety of formats.

Transform
Secondly, we transform the data through cleansing, classify, categorising and enriching the data.

Combine
Next, we combine the data to create meaningful links within the dataset.

Publish
Finally, we share analytics to allow discovery and insight.
Our fleet analytics platform can take information from various sources, including Excel, CSV, text and XML.
Firstly, once we have received the data, it goes through a process to check and cleanse the data to identify erroneous records and align data types.
Secondly, we enrich the data by applying classifications to assign records against data types.
Next, the data is combined and linked to create associations between the data tables.
Finally, we create a bespoke dashboard. Using our extensive fleet knowledge allows us to create dashboards that provide a deep understanding of the fleet data set. We then tailor the look and feel to the specific requirements of our customers. Moreover, as the data changes over time, the dashboard can change to meet the new circumstances.
The data is available through an online portal which you can also download to support individual reporting requirements.
Case Study
Client:
Global Support Services Business operating 17,000 vehicles in over 30 countries
Challenge:
Like many organisations with large fleets, the customer had difficulty managing the fleet across a range of different suppliers in different geographical locations. Similarly, due to the range of suppliers, the fleet data existed in various formats, languages and currencies. The customer required a single-point view of the entire fleet with important data automatically aggregated and presented.
Solution:
Firstly, by implementing Fleet Analytics, the customer could view their full global fleet by location, operating company and vehicle type, including the total cost of ownership for each variant. The platform also allowed complete visibility of critical data such as average C02 emissions, forecast renewal dates and invoiced spend split between fixed, variable and avoidable. Finally, adding fleet budgets to the system meant the client could track fleet spending and verify the impact of efficiency initiatives.
